Last Update: April 13, 2021. 9:50 AM EST
Legal disclaimer: I am not a financial advisor. The advice here given is not a financial advice. You trade at your own risk and nobody can guarantee you results.
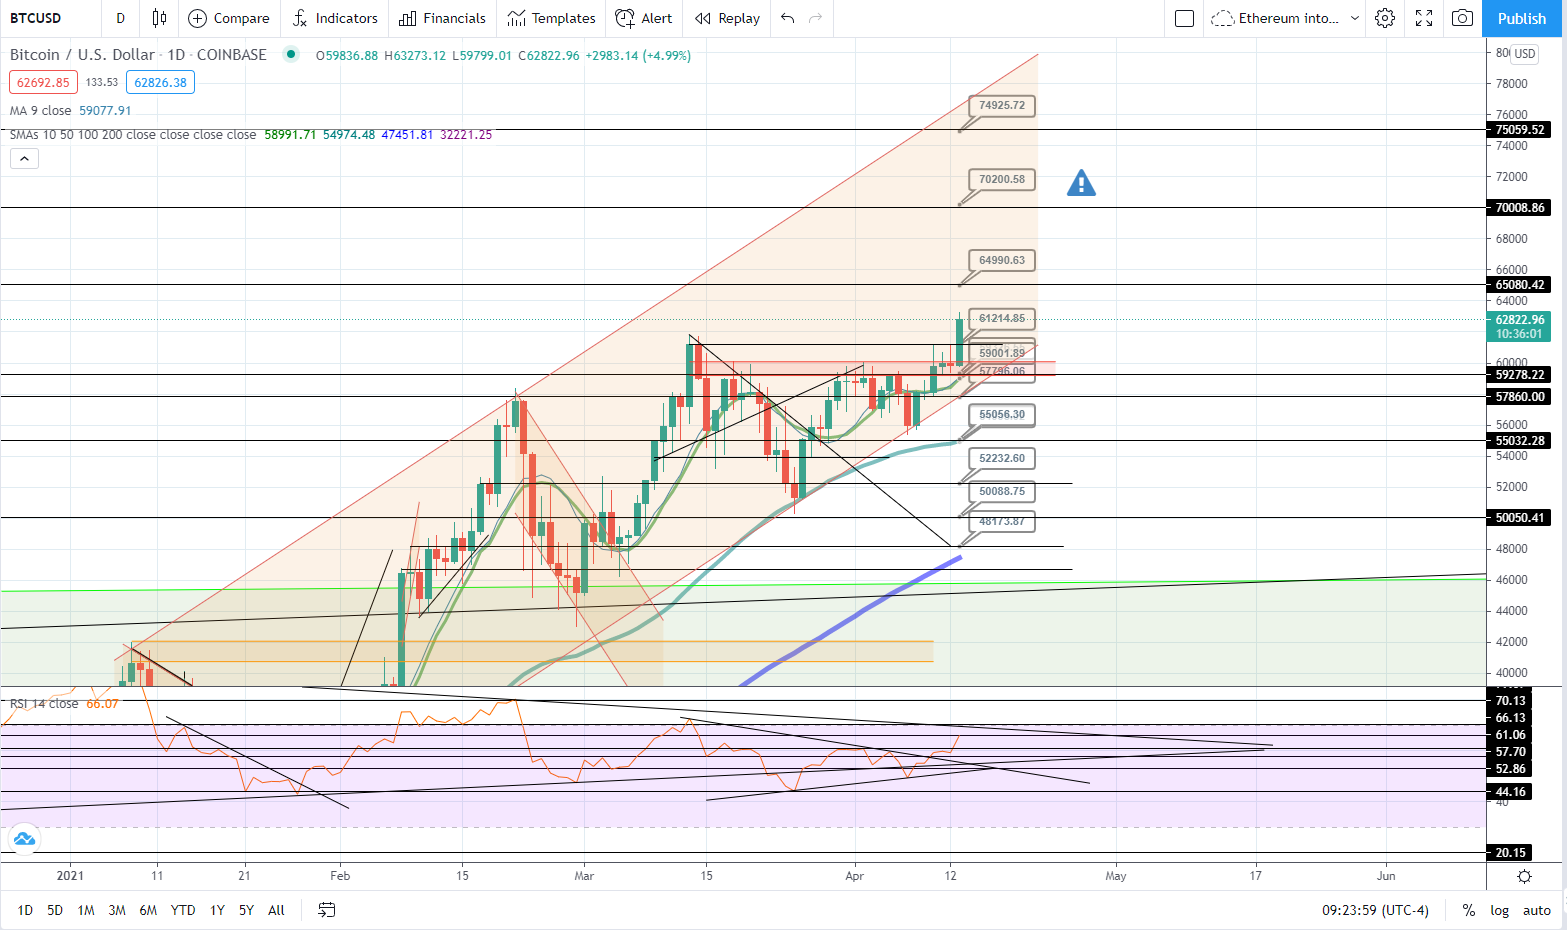
Here is the daily bitcoin chart. We finally broke all time high and have now entered “price discovery mode” once again. The RSI looks good here with a solid pop overnight gaining about 3k in value. Our next targets should be 65k as well as 70k. I’m leaning toward the RSI running toward 70k. We will then find out how much of a resistance that level can be.
How I would trade: HODL
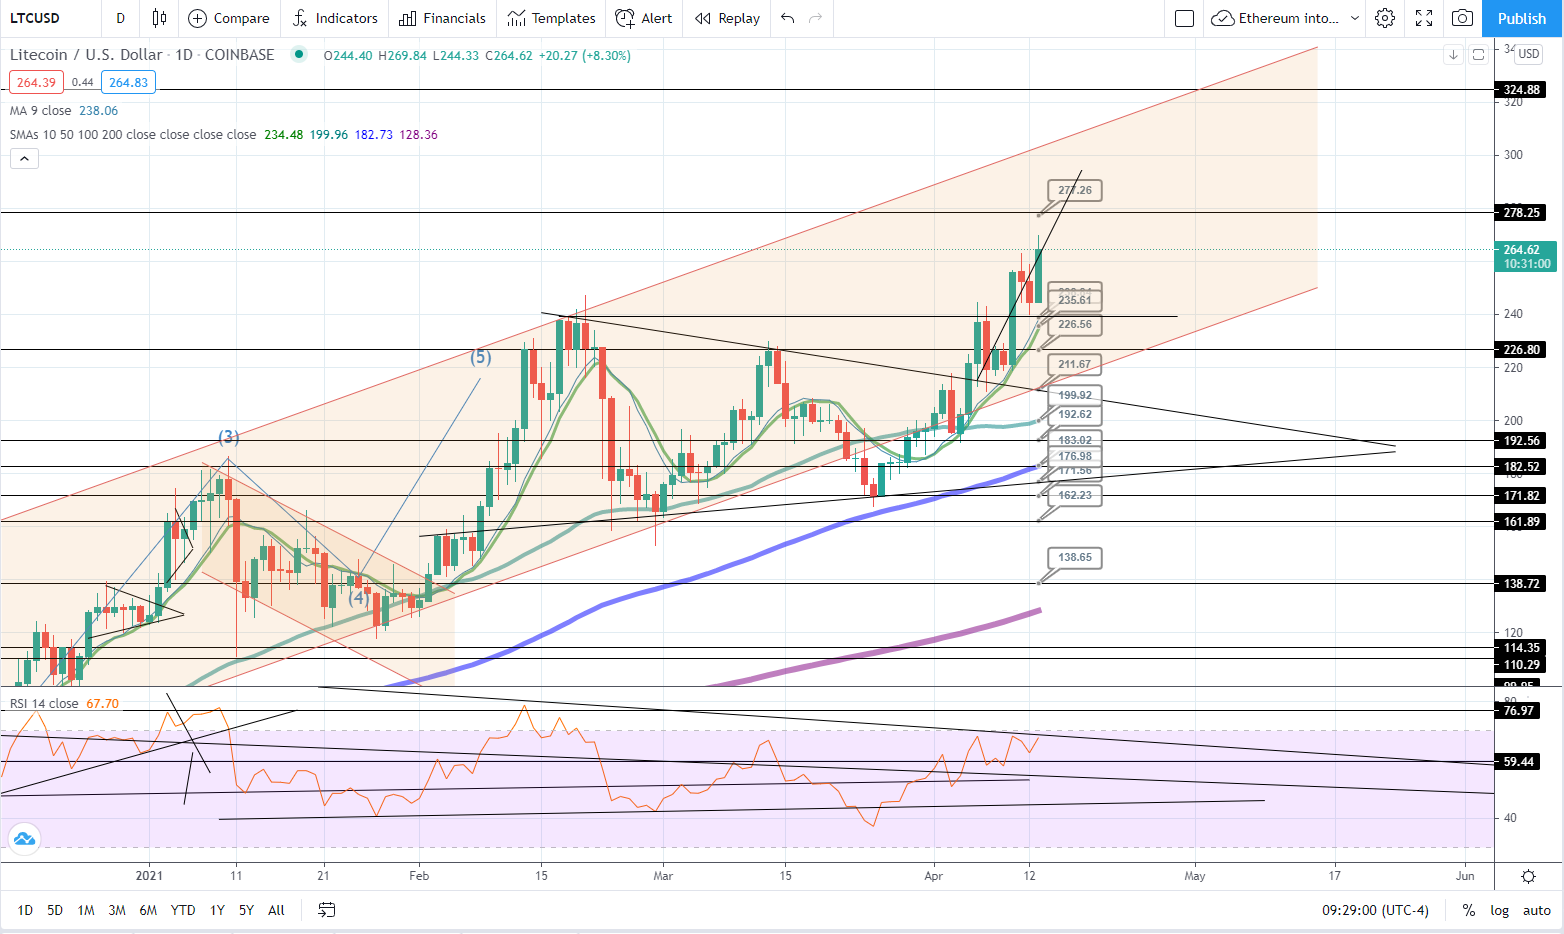
Litecoin looks close to ethereum in the sense that it broke upward out of a pennant then successfully backetested. Our measured move takes us to 277 but I'm keeping my eye on the prize at the 325 price point. If the RSI can break upward it will run hard before a pullback. I expect the 325 area to be the touger of the resistance levels.
Sentiment: Swing Long, currently holding
How I would trade: I stopped accumulating and now I am just holding my coins for the ride
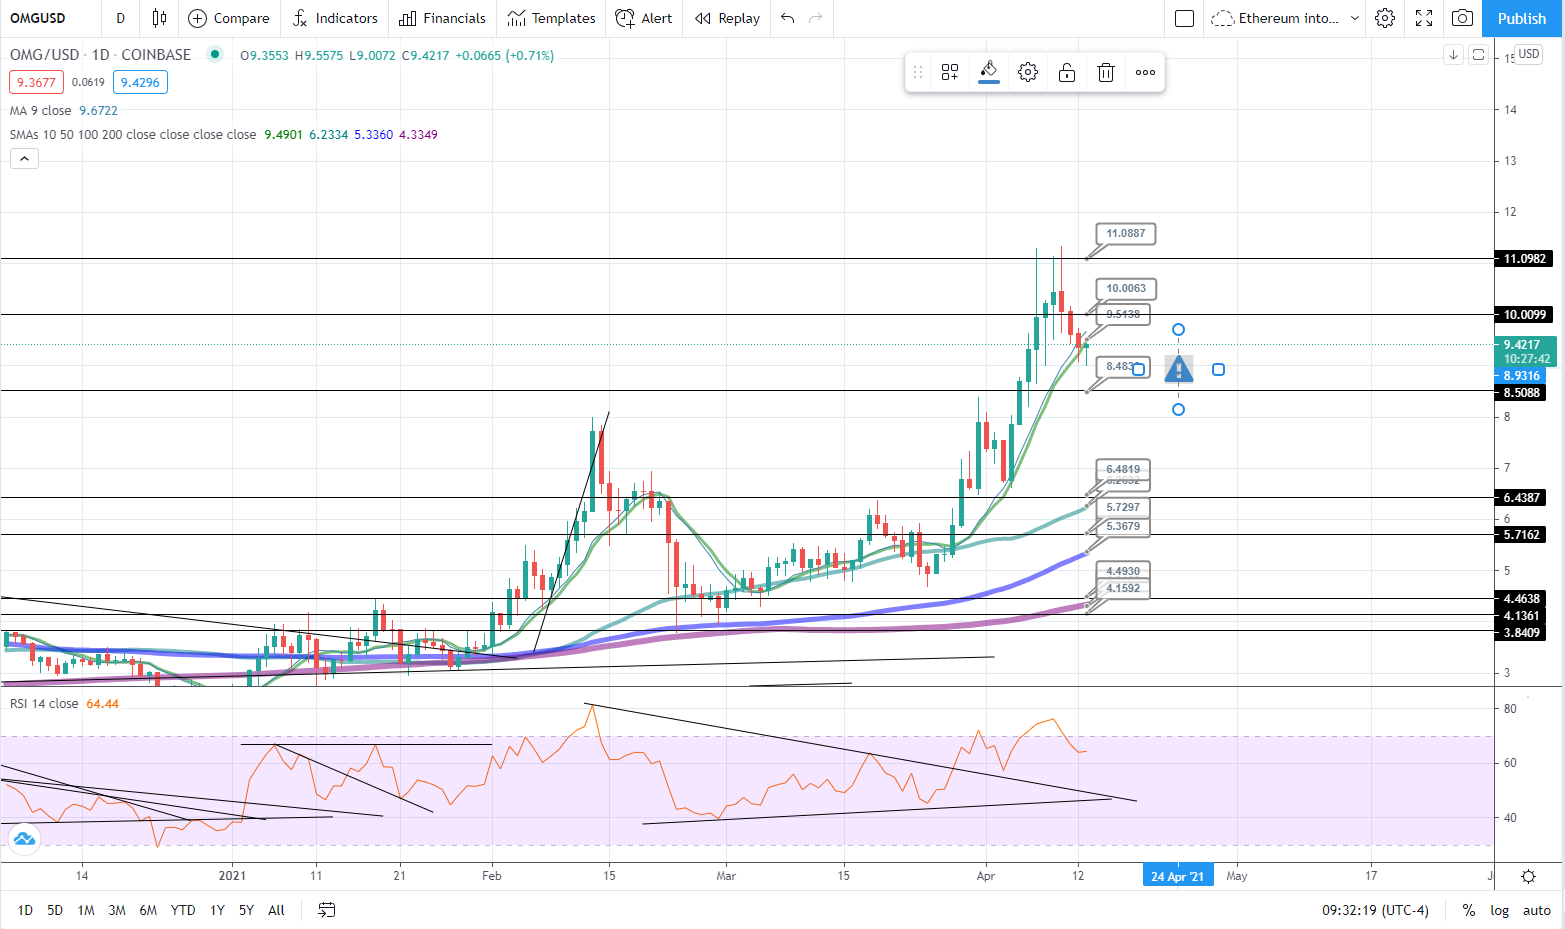
OMG is very volatile but insanely bullish still. My last update I said i would have covered to protect my gains. It’s pulling back and something well timed can certainly be lucrative. Any price near the 8.48 mark I really like for entry. Then off to another test of ATH around $11. Be patient with this trade. A well timed scalp could land you 30%.
Sentiment: bullish
How I would trade: Wait for decent price entry near supports

XRP has absolutely shocked me from its humble roots around .20 to rip all the way over $1 dollar. The RSI is totally cooked and I expect a decent size pullback (or backtest) of the 1.40 region before ripping again. If it continues behaving like this, 2.75 will be here before you know it.
Sentiment: bullish
How to trade: Ripple lawsuit is making this trade complicated. Coinbase is no longer allowing trades on XRP.
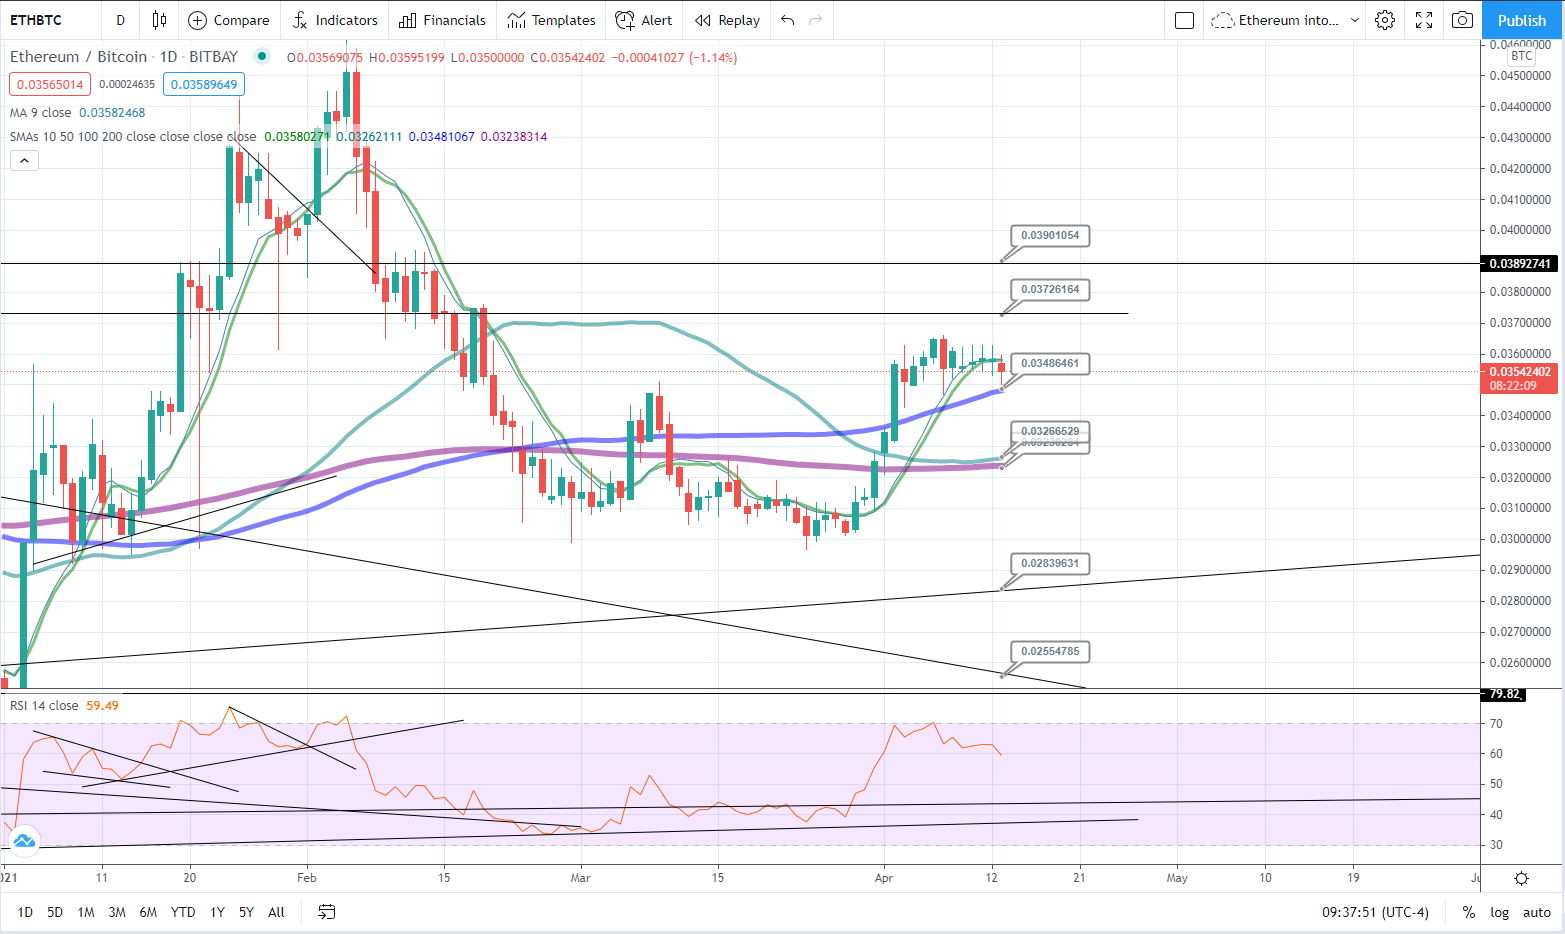
The ETH/BTC chart looks amazing. It looks like it’s just taking a breather after a big breakout. Next stop is .037 which I have a feeling aligns with the 2,500 price point of ethereum.
Note: Remember. The more suppressed this ratio is, the faster bitcoin will gain on alts. Vice Versa is true. Once this breaks out, ethereum will lead alts to the moon!
Sentiment: bullish
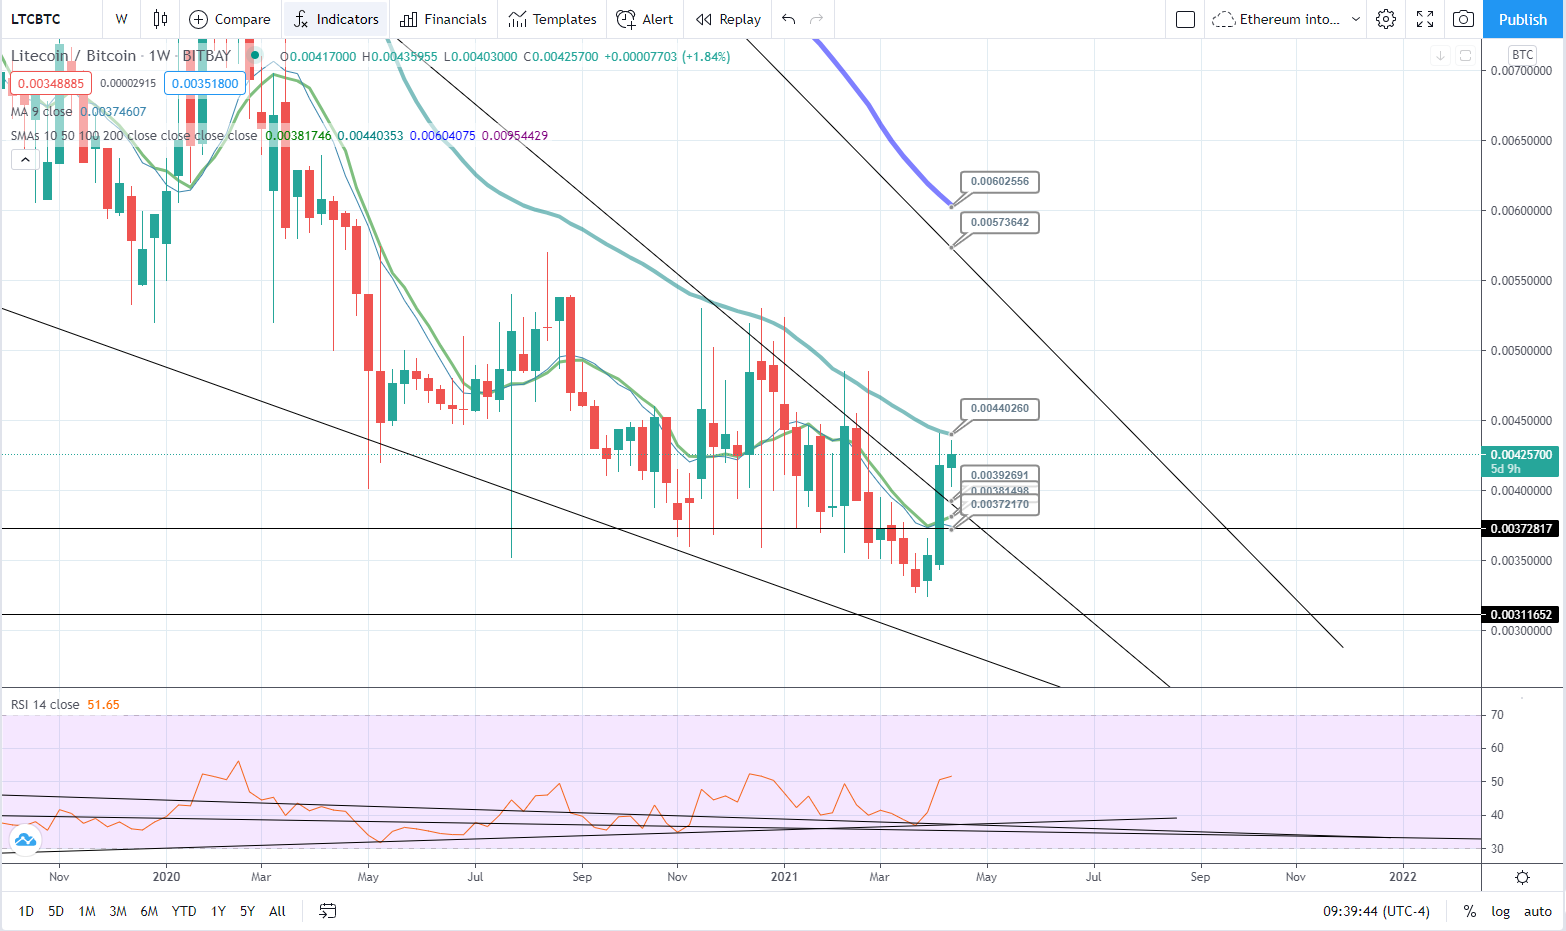
Litecoin broke upward out of the falling wedge and started making intense gains quickly. It has appreciated almost 50% in the past 8 days. Here in the ltc/btc chart we see the next hurdle. If we get above the .0044 resistance we will absolutely rip to .0057 in a flash. More gains on the horizon.

